Example Applications
Read a raw measurement file, fit a curve, save and plot the results
>>> import matplotlib.pyplot as plt
>>> import numpy as np
>>> from SDF.data_model import Workspace, ArrayDataset1D
>>> from SDF.file_io import write_sdf, load_from_sdf

>>> # 0. create some data (usually read from measurement file)
>>> n_points = 20
>>> a, b = 3, 1.5
>>> x = np.linspace(0, 10, n_points)
>>> y = a*x + b + np.random.normal(size=n_points)
>>> ws = Workspace(name="top-level workspace", owner="Albertus")
>>> ws.datasets.add(ArrayDataset1D(name="x", data=x, unit="mm"))
>>> ws.datasets.add(ArrayDataset1D(name="y", data=y, unit="nmol"))
>>> ws.instruments["Supermeter 2000"] = {"nickname": "Sir cannot-fail",
...                                      "settings": {"good day": True, "mood": 10}}
>>> write_sdf(ws, "my-results.sdf")

>>> # 1. read data, fit curve
>>> ws = load_from_sdf("my-results.sdf")
>>> fit_a, fit_b = np.polyfit(x, y, deg=1)

>>> # 2. add fit results to workspace
>>> ws.parameters["fit results"] = {"a": (fit_a, "nmol"),
...                                 "b": (fit_b, "nmol/mm"),
...                                 "method": {"name": "np.polyfit", "degree": 1}}
>>> write_sdf(ws, "my-results.sdf")

>>> # 3. plot
>>> x = ws.datasets["x"].data
>>> x_unit = ws.datasets["x"].unit
>>> y = ws.datasets["y"].data
>>> y_unit = ws.datasets["y"].unit
>>> fit_a = float(ws.parameters["fit results"]["a"].value)
>>> fit_b = float(ws.parameters["fit results"]["b"].value)
>>> def plot(x, y, y_fit, x_unit, y_unit):
...     plt.plot(x, y, "xk", label="measurement")
...     plt.plot(x, y_fit, "--r", label="fit")
...     plt.xlabel(f"$x$ /{x_unit}")
...     plt.ylabel(f"$y$ /{y_unit}")
...     plt.legend()
...     plt.title("Results")
...     plt.tight_layout()
>>> plot(x, y, fit_a*x + fit_b, x_unit, y_unit)
>>> plt.savefig("my-results.png")
The resulting file my-results.sdf will look like this:
<?xml version="1.0" encoding="utf-8"?>
<!DOCTYPE workspace>
<workspace>
   <name>
      top-level workspace
   </name>
   <owner>
      Albertus
   </owner>
   <par name="fit results">
      <par name="a" value="2.9781712899700308" unit="nmol"/>
      <par name="b" value="1.5456773747402146" unit="nmol/mm"/>
      <par name="method">
         <par name="degree" value="1"/>
         <par name="name" value="np.polyfit"/>
      </par>
   </par>
   <instrument>
      <name>
         Supermeter 2000
      </name>
      <par name="nickname" value="Sir cannot-fail"/>
      <par name="settings">
         <par name="good day" value="True"/>
         <par name="mood" value="10"/>
      </par>
   </instrument>
   <dataset type="sc">
      <name>
         x
      </name>
      <unit value="mm"/>
      <data rows="20" cols="1" type="float">
         0.0 0.5263157894736842 1.0526315789473684 1.5789473684210527 2.1052631578947367 2.631578947368421
         3.1578947368421053 3.6842105263157894 4.2105263157894735 4.7368421052631575 5.263157894736842 5.789473684210526
         6.315789473684211 6.842105263157895 7.368421052631579 7.894736842105263 8.421052631578947 8.947368421052632
         9.473684210526315 10.0
      </data>
   </dataset>
   <dataset type="sc">
      <name>
         y
      </name>
      <unit value="nmol"/>
      <data rows="20" cols="1" type="float">
         1.0194935272080436 3.313324719409985 4.016299212544986 7.627843194351737 6.31005069389586 10.487992770591923
         11.123057149457448 11.80545784430888 14.494353262577148 14.824419224980307 18.545437261147292 18.63781216938566
         20.146171321403752 22.963561113724747 23.964314703838614 25.80381228448588 24.440242187106243
         27.620432980775806 29.404287266310554 32.18231360430237
      </data>
   </dataset>
</workspace>
The plot will look like this:
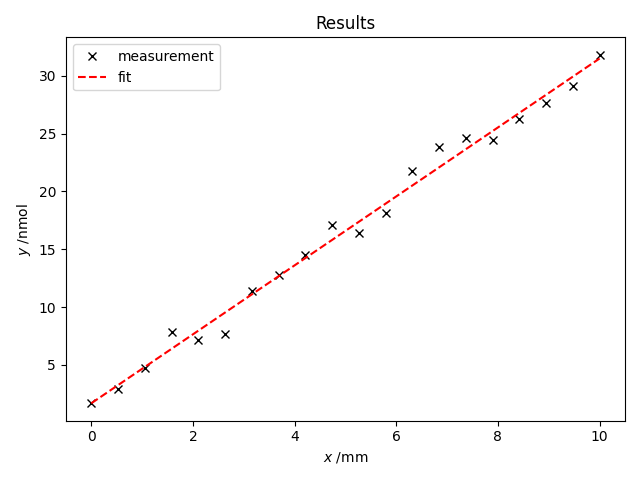
Fig. 19 my-results.png
Generate a nested Workspace with multiple Datasets
>>> from datetime import datetime
>>> from PIL import Image
>>> import numpy as np
>>> from SDF.data_model import Workspace, ImageDataset, ArrayDataset1D
>>> from SDF.file_io import write_sdf

>>> sdf = Workspace(name="my experiment", owner="me", date=datetime.now())
>>> sdf.comment = "comment on the experiment"
>>> sdf.samples["my first sample"] = "sample description"
>>> sdf.samples["my second sample"] = "sample description"

>>> measurement_1 = Workspace("my first measurement")
>>> sdf.workspaces.add(measurement_1)
>>> measurement_1.comment = "comment on my first measurement:\n" \
...                         "  - it consists of two images\n" \
...                         "  - they are random, but beautiful!"
>>> measurement_1.instruments["my microscope"] = dict(cost=(9001, "EUR"), color="black")
>>> image_1 = Image.fromarray(np.random.randint(0, 255, (10, 10), dtype=np.uint8))  # random 10x10 image
>>> image_2 = Image.fromarray(np.random.randint(0, 255, (10, 10), dtype=np.uint8))
>>> measurement_1.datasets.add(ImageDataset("image 1", image_1))
>>> measurement_1.datasets["image 1"].parameters["zoom-level"] = 30
>>> measurement_1.datasets["image 1"].parameters["wavelength"] = 509, "nm"
>>> measurement_1.datasets.add(ImageDataset("image 2", image_2))

>>> measurement_2 = Workspace("my second measurement")
>>> sdf.workspaces.add(measurement_2)
>>> measurement_2.comment = "comment on my first measurement"
>>> x = np.arange(100)
>>> y = np.random.randint(0, 10, 100)
>>> measurement_2.datasets.add(ArrayDataset1D("x", x))
>>> measurement_2.datasets.add(ArrayDataset1D("y", y))

>>> write_sdf(sdf, "my-results.sdf")
The resulting file my-results.sdf would look like this:
<?xml version="1.0" encoding="utf-8"?>
<!DOCTYPE workspace>
<workspace>
   <name>
      my experiment
   </name>
   <owner>
      me
   </owner>
   <date>
      2021.03.03 11:01:28
   </date>
   <comment>
      comment on the experiment
   </comment>
   <sample>
      <name>
         my first sample
      </name>
      <comment>
         sample description
      </comment>
   </sample>
   <sample>
      <name>
         my second sample
      </name>
      <comment>
         sample description
      </comment>
   </sample>
   <workspace>
      <name>
         my first measurement
      </name>
      <comment>
         comment on my first measurement:
           - it consists of two images
           - they are random, but beautiful!
      </comment>
      <instrument>
         <name>
            my microscope
         </name>
         <par name="color" value="black"/>
         <par name="cost" value="9001" unit="EUR"/>
      </instrument>
      <dataset type="img">
         <name>
            image 1
         </name>
         <par name="zoom-level" value="30"/>
         <par name="wavelength" value="509" unit="nm"/>
         <data encoding="base64" type="image/png">
            iVBORw0KGgoAAAANSUhEUgAAAAoAAAAKCAAAAACoWZBhAAAAeUlEQVR4nAFuAJH/AZAWa0VE4fDv
            DEMAWrhy8Ap+NRE0VwIP2W6xVnz36/tkBECg6Br6DZSfxtwArc1sCMhI+QTlQASDQCtSFPwonKkl
            ABlDAnNLCJI3owsBn1+a/M2JOlv88QBxoT/oB/x8FtApAak8PoLosFYFybBPszA9DBBXFAAAAABJ
            RU5ErkJggg==
         </data>
      </dataset>
      <dataset type="img">
         <name>
            image 2
         </name>
         <data encoding="base64" type="image/png">
            iVBORw0KGgoAAAANSUhEUgAAAAoAAAAKCAAAAACoWZBhAAAAeUlEQVR4nAFuAJH/AV2nPj/syu3s
            q1EAGGJHzgLvp7gliQJd+s1UeOgI0TtGALgZ+RDJLsZBD6cC0WE59UEZBdHxFwAhlFXietBCH3tj
            AFEbsOITtH4B3qcAzD/+lO8Iz5QyfAGIISIjCDwTyvp2AFHbtb0Fkcn8INWzmDFI/vtkfAAAAABJ
            RU5ErkJggg==
         </data>
      </dataset>
   </workspace>
   <workspace>
      <name>
         my second measurement
      </name>
      <comment>
         comment on my first measurement
      </comment>
      <dataset type="sc">
         <name>
            x
         </name>
         <data rows="100" cols="1" type="int">
            0 1 2 3 4 5 6 7 8 9 10 11 12 13 14 15 16 17 18 19 20 21 22 23 24 25 26 27 28 29 30 31 32 33 34 35 36 37 38
            39 40 41 42 43 44 45 46 47 48 49 50 51 52 53 54 55 56 57 58 59 60 61 62 63 64 65 66 67 68 69 70 71 72 73 74
            75 76 77 78 79 80 81 82 83 84 85 86 87 88 89 90 91 92 93 94 95 96 97 98 99
         </data>
      </dataset>
      <dataset type="sc">
         <name>
            y
         </name>
         <data rows="100" cols="1" type="int">
            0 1 4 6 7 3 4 0 8 5 9 7 7 6 2 8 1 4 9 5 8 9 5 6 8 4 5 8 1 9 8 9 1 5 1 3 7 2 0 9 0 2 0 6 6 2 0 3 6 4 0 1 2 2
            5 6 4 6 9 9 2 0 6 3 4 1 6 2 8 7 7 6 5 5 6 4 0 6 7 5 8 7 8 4 2 0 3 0 4 5 2 7 5 7 4 5 8 2 2 0
         </data>
      </dataset>
   </workspace>
</workspace>